NFL Analytics Suite
R
xgboost
tidymodels
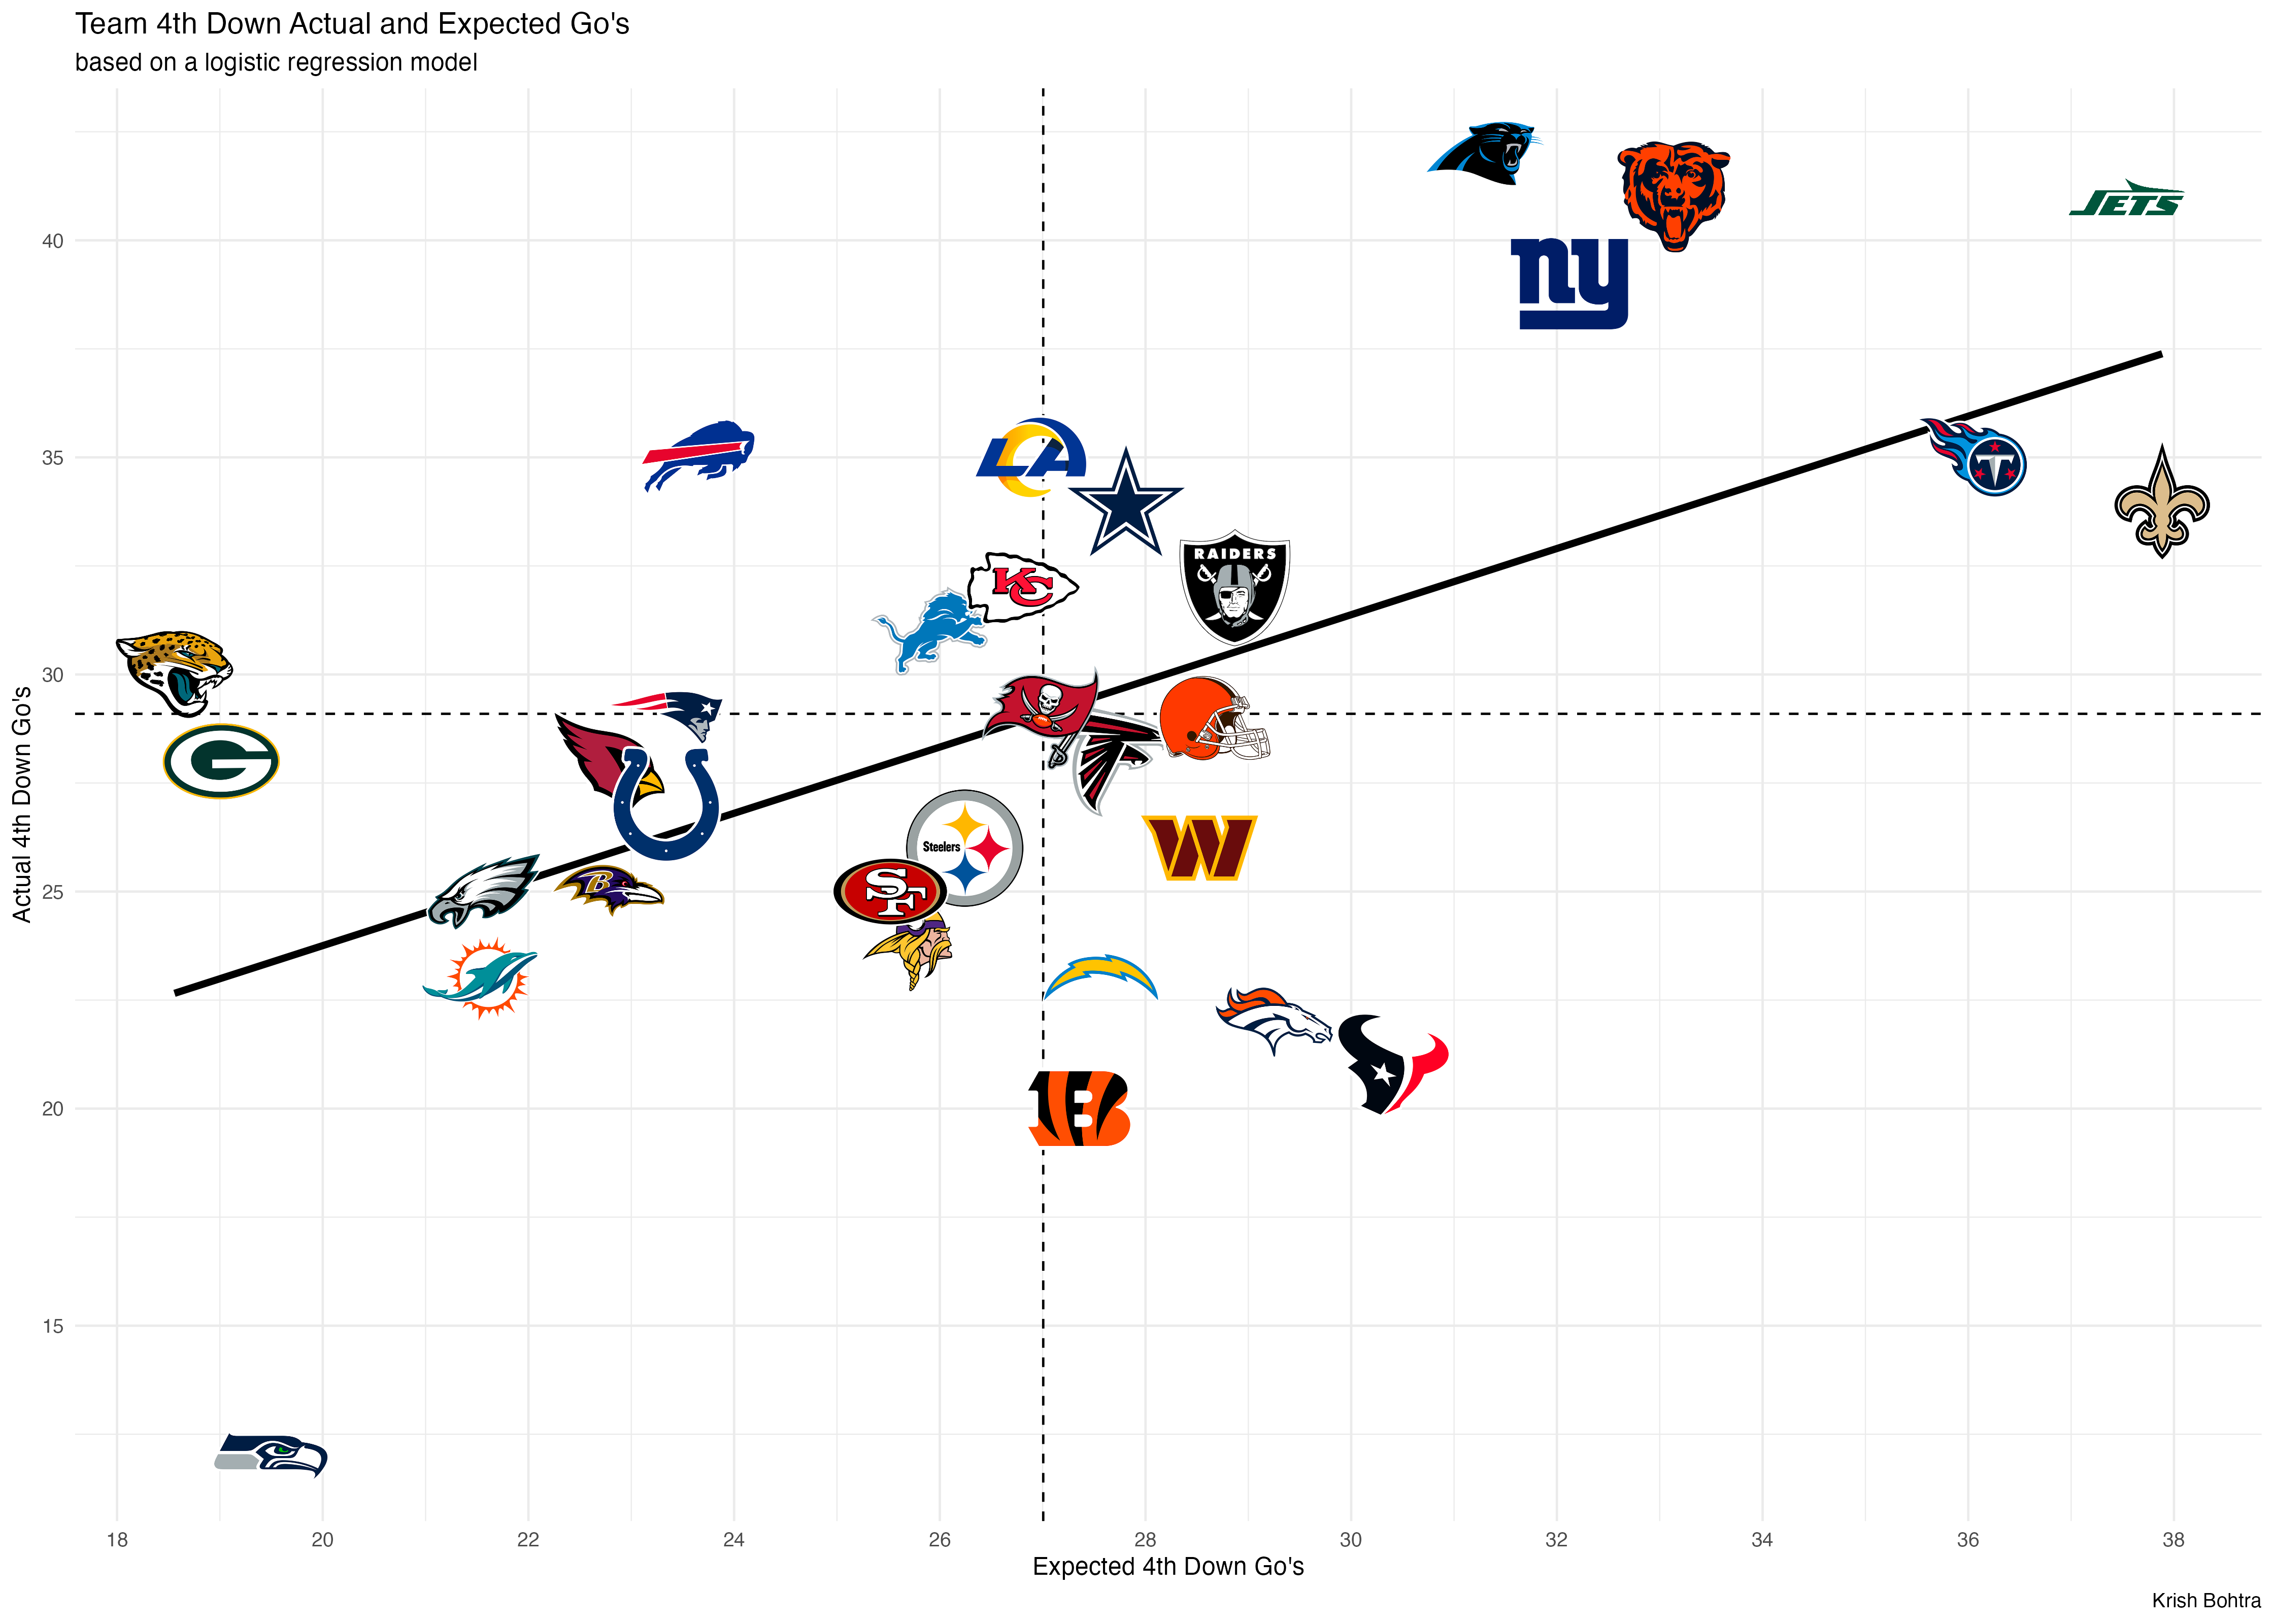
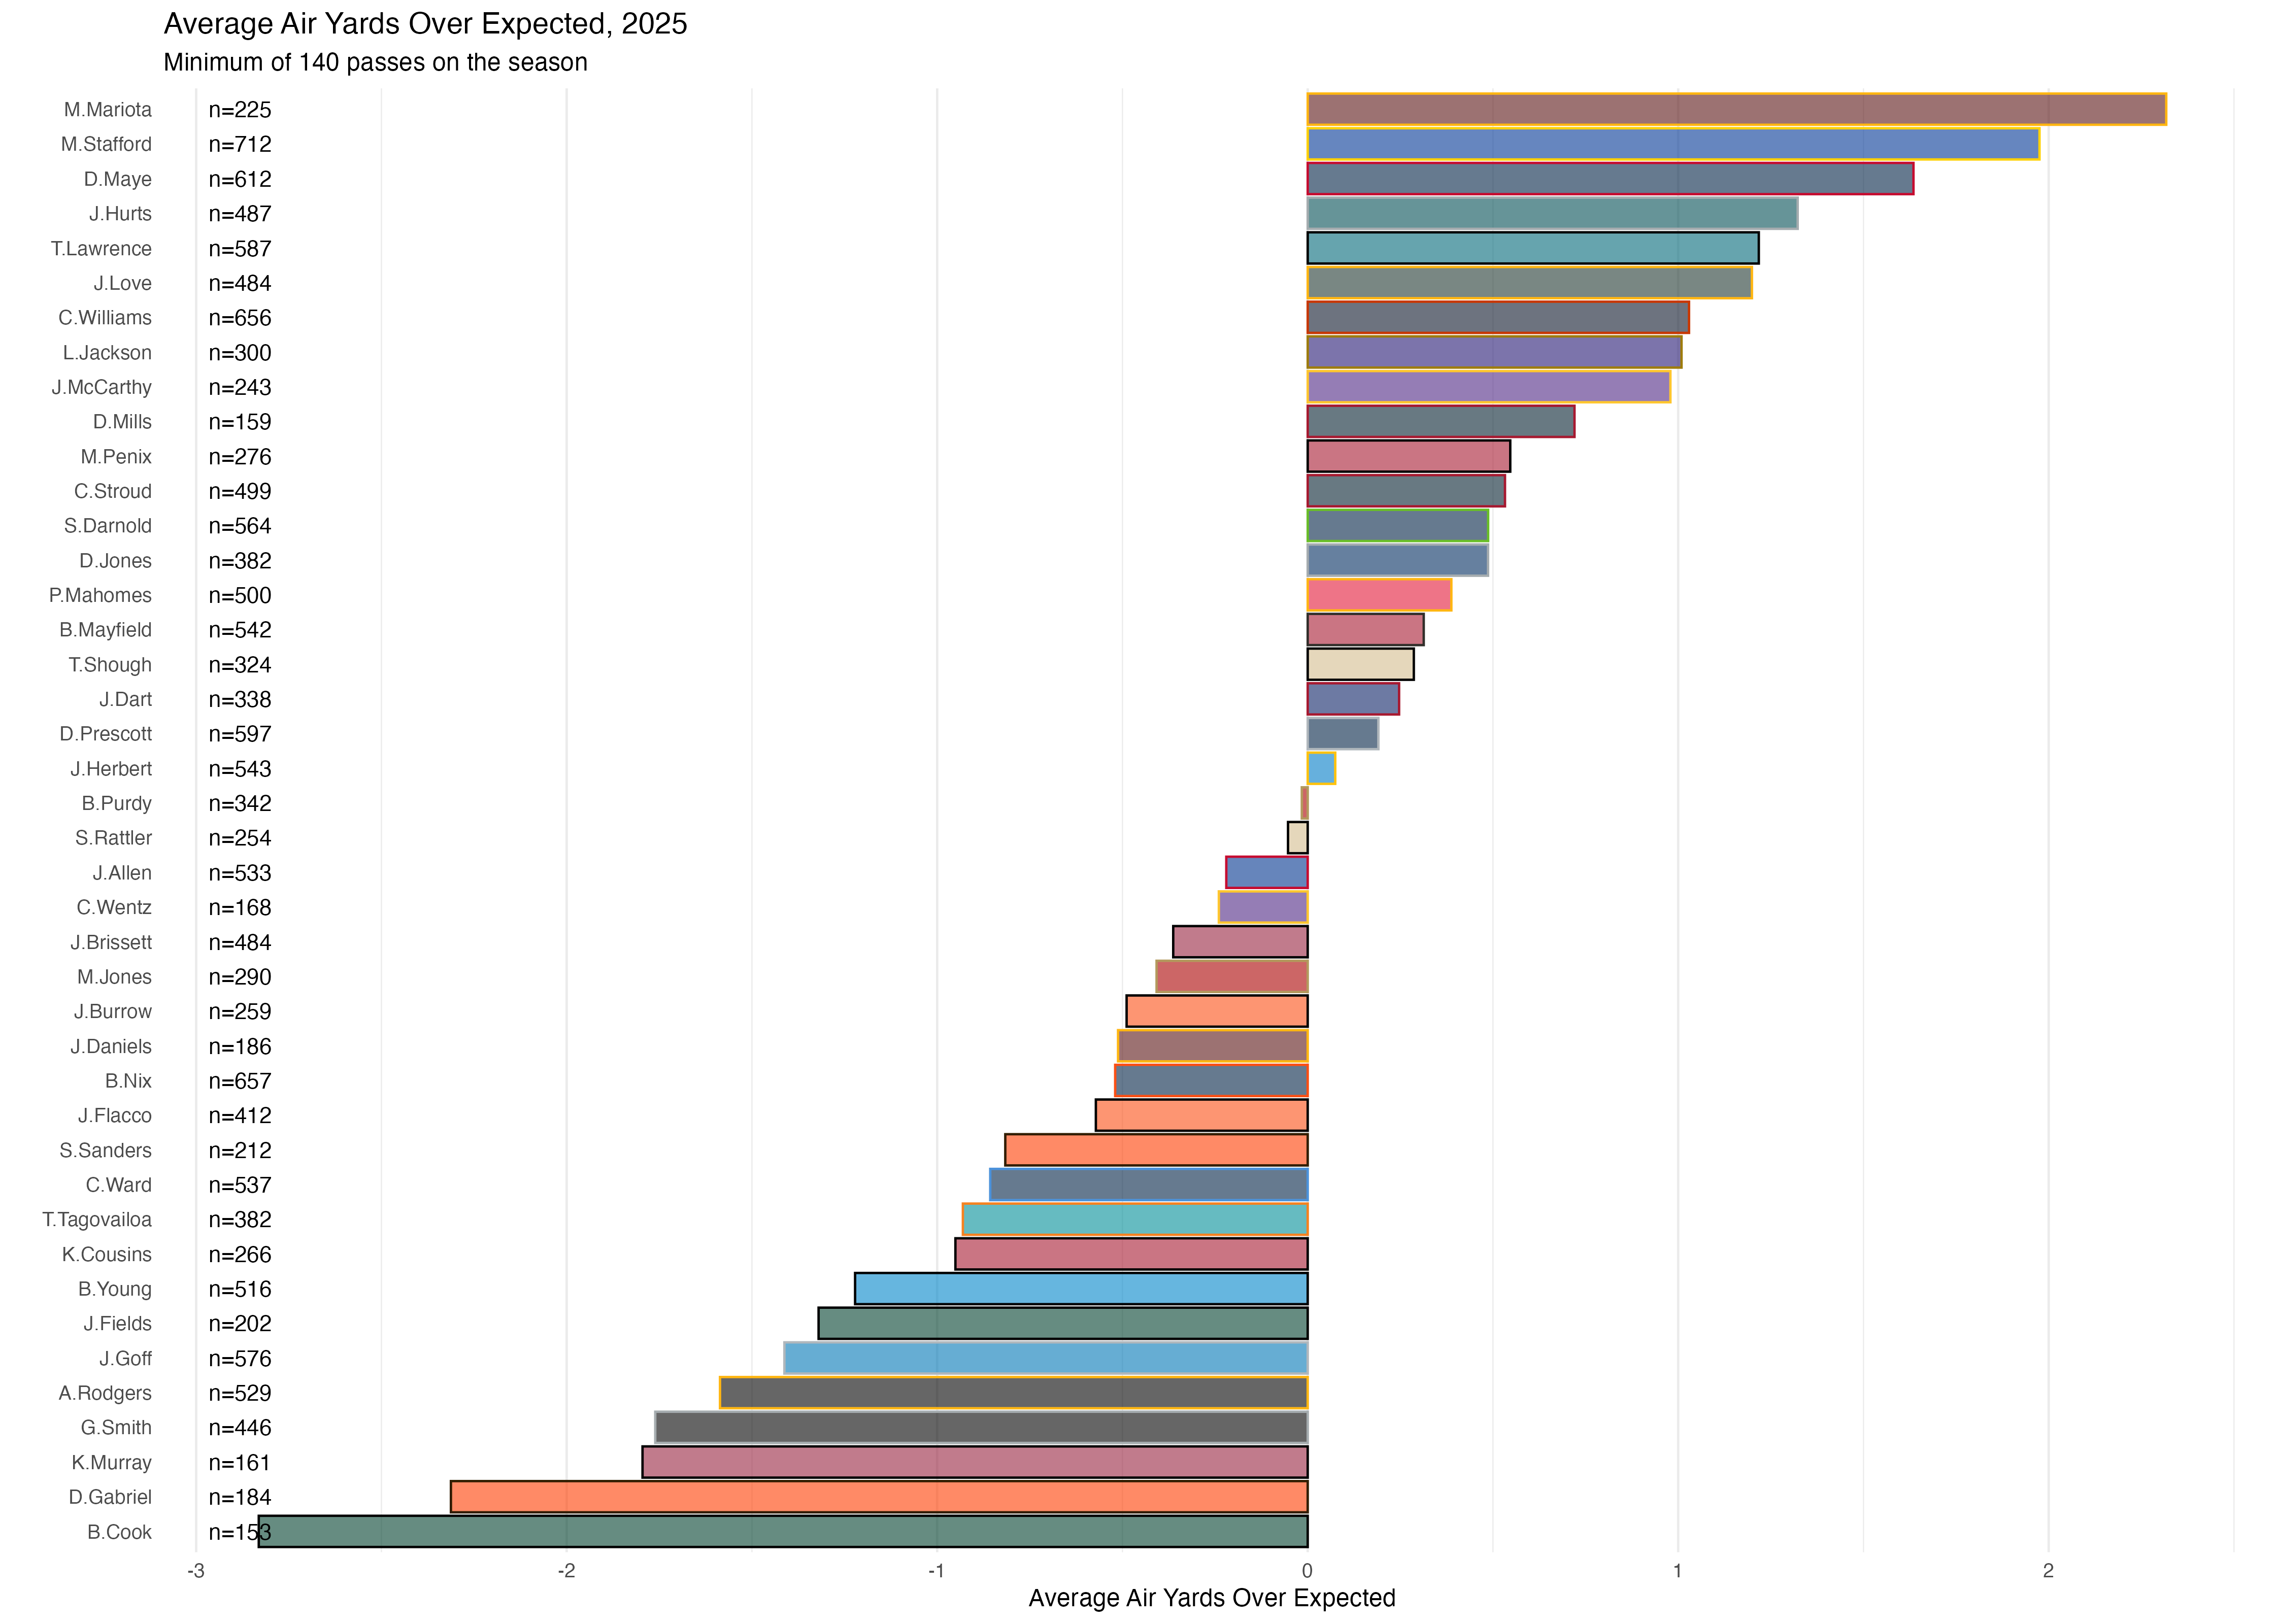
Models and visualizations of fourth-down decisions, rushing and passing yards over expected, and team performance across four NFL seasons.
Overview
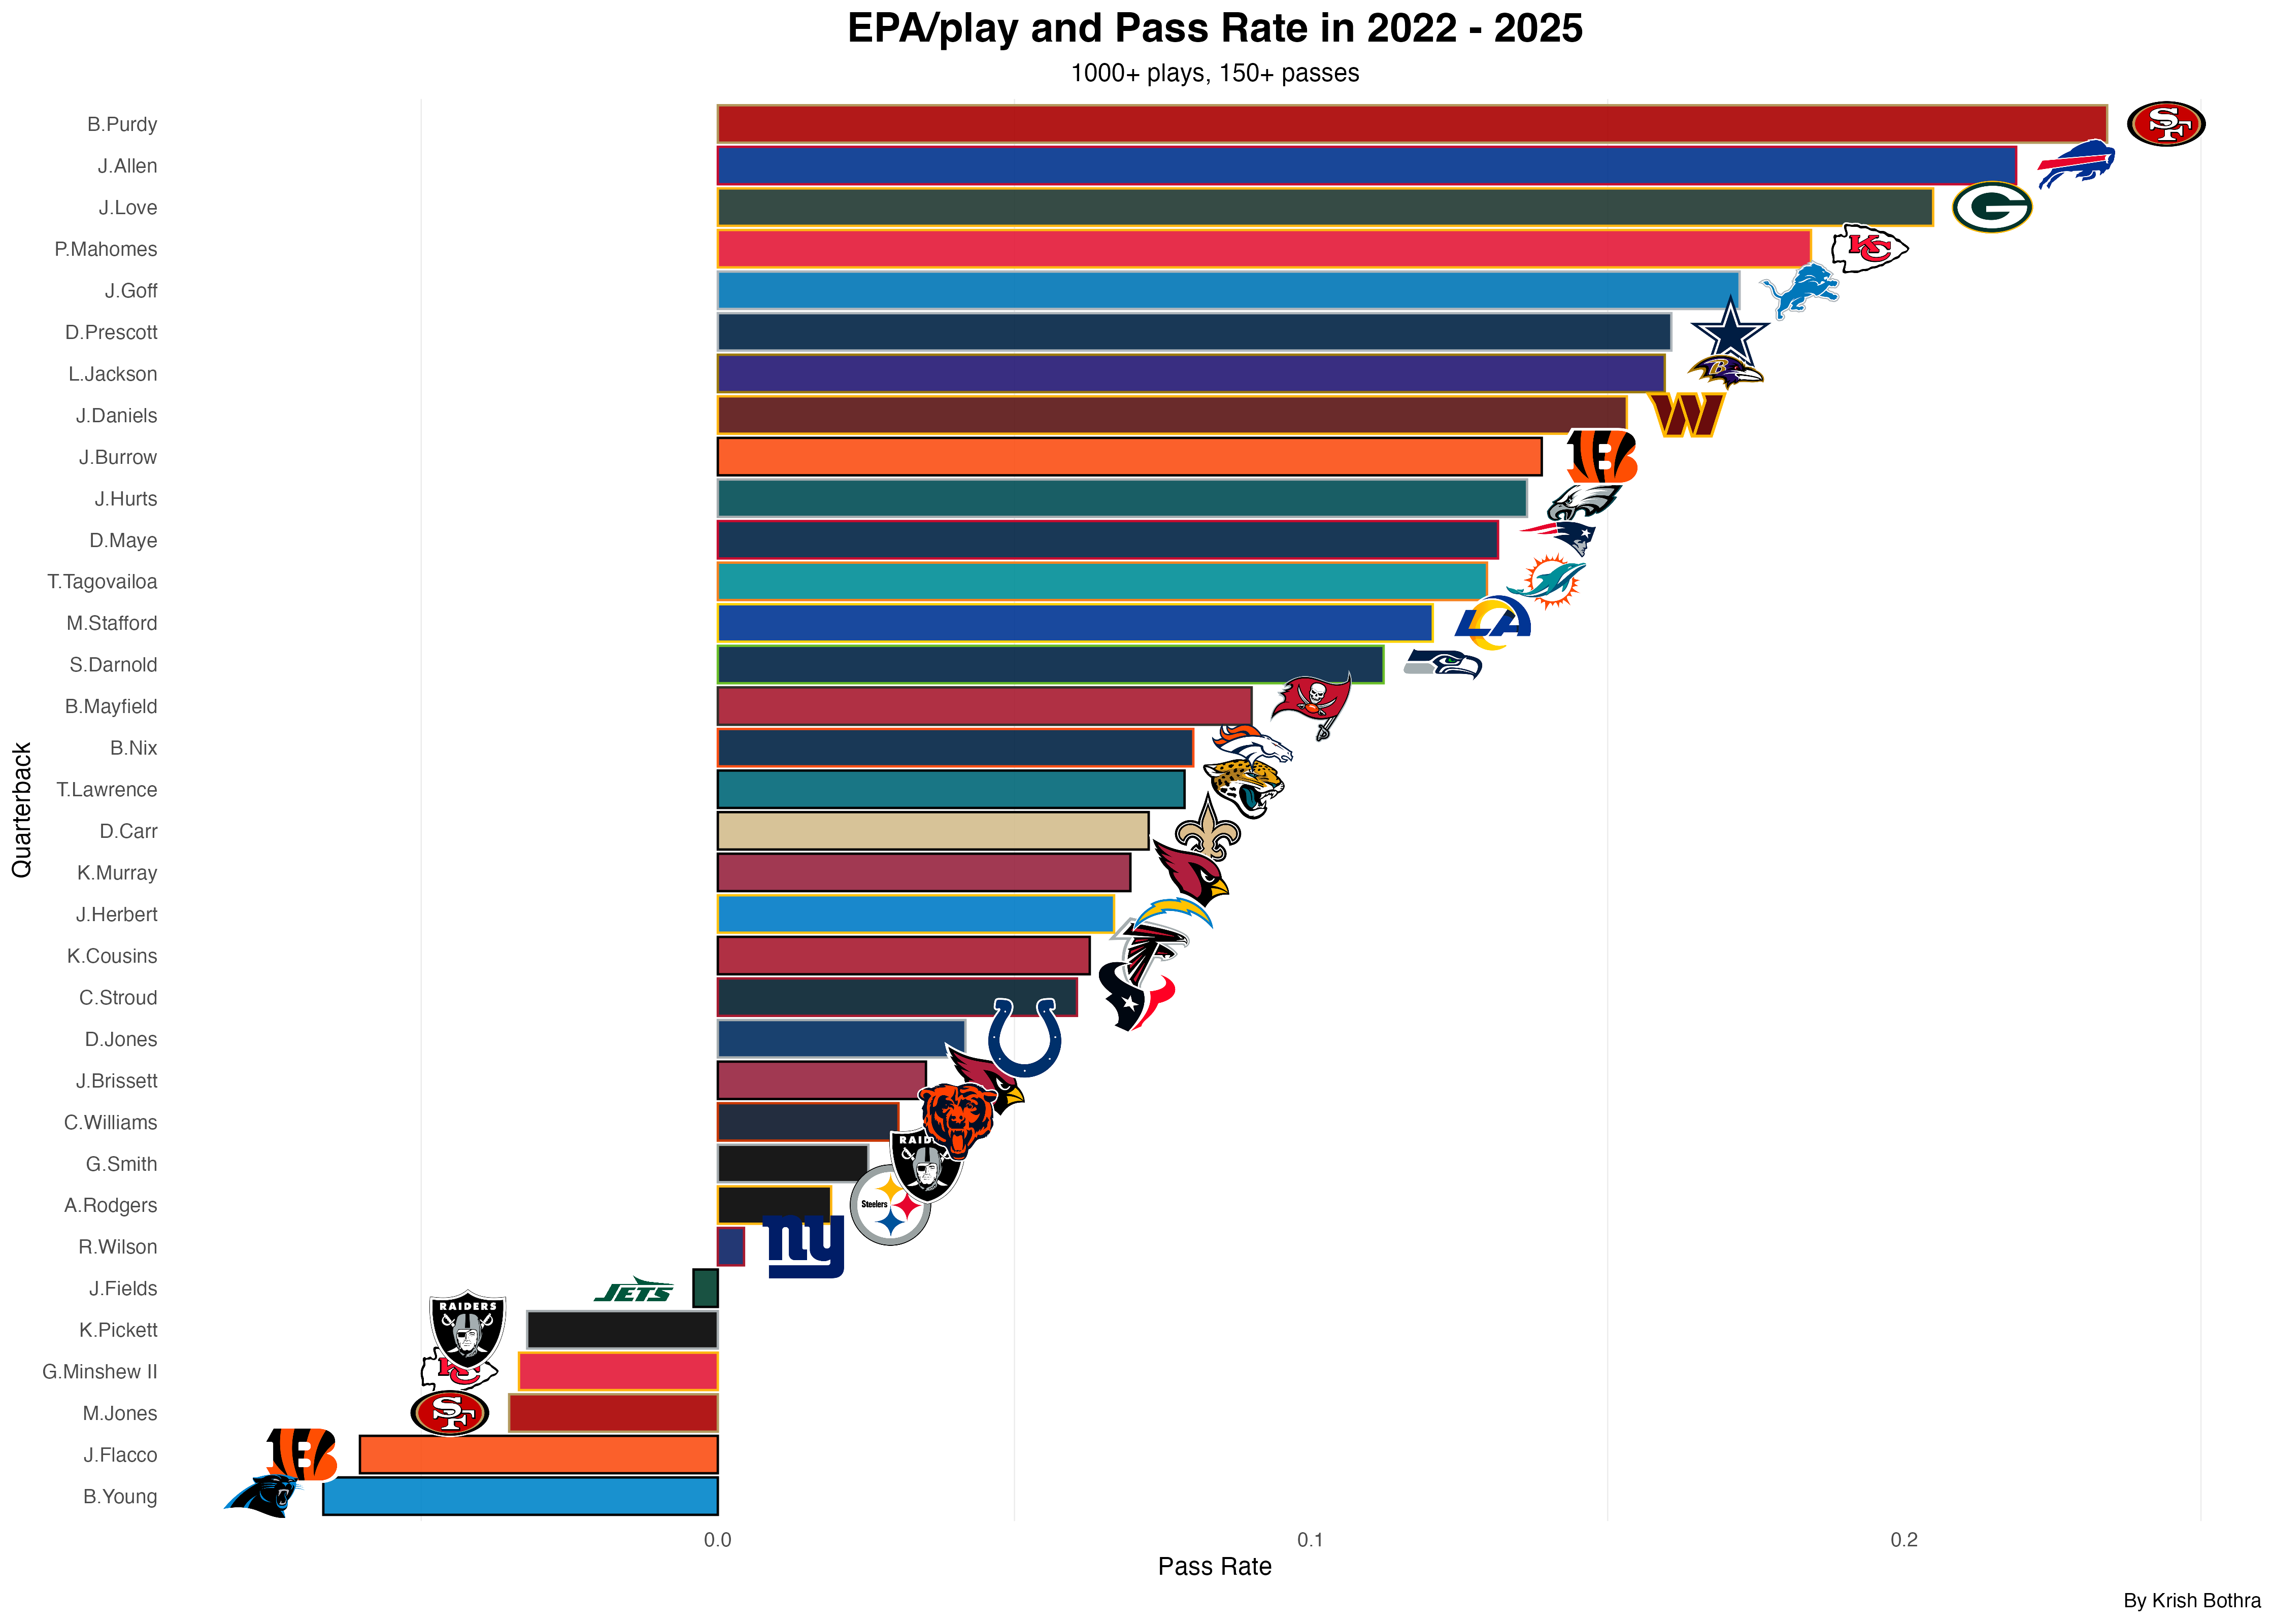
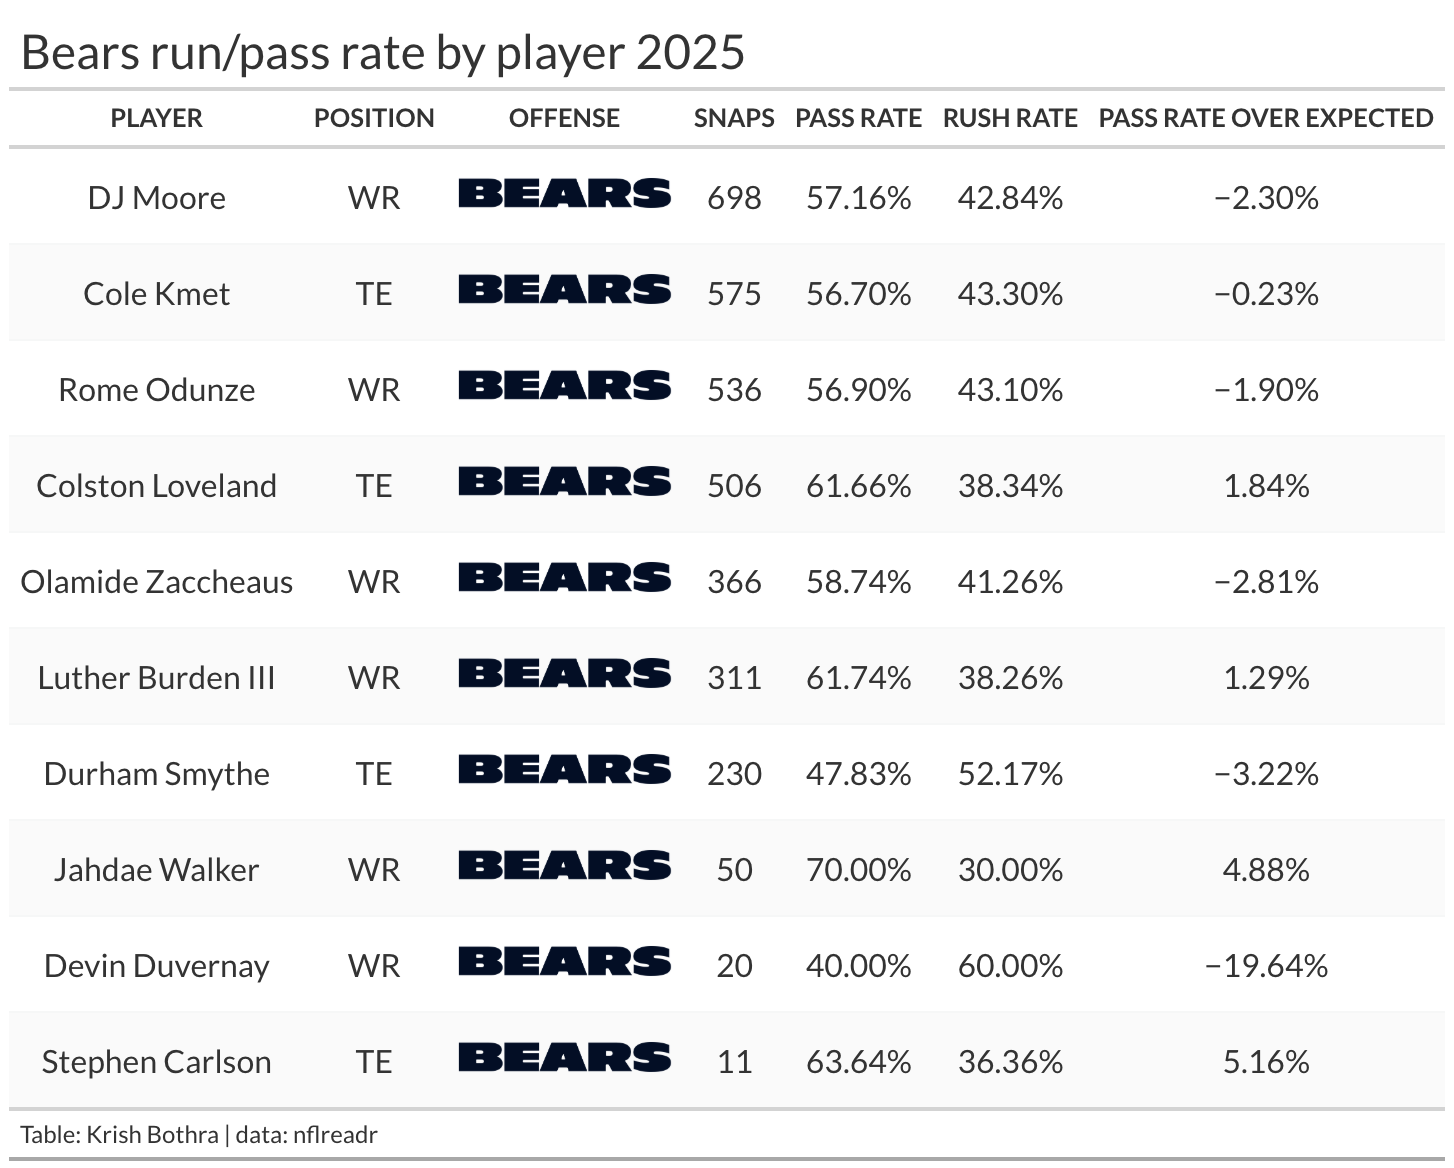
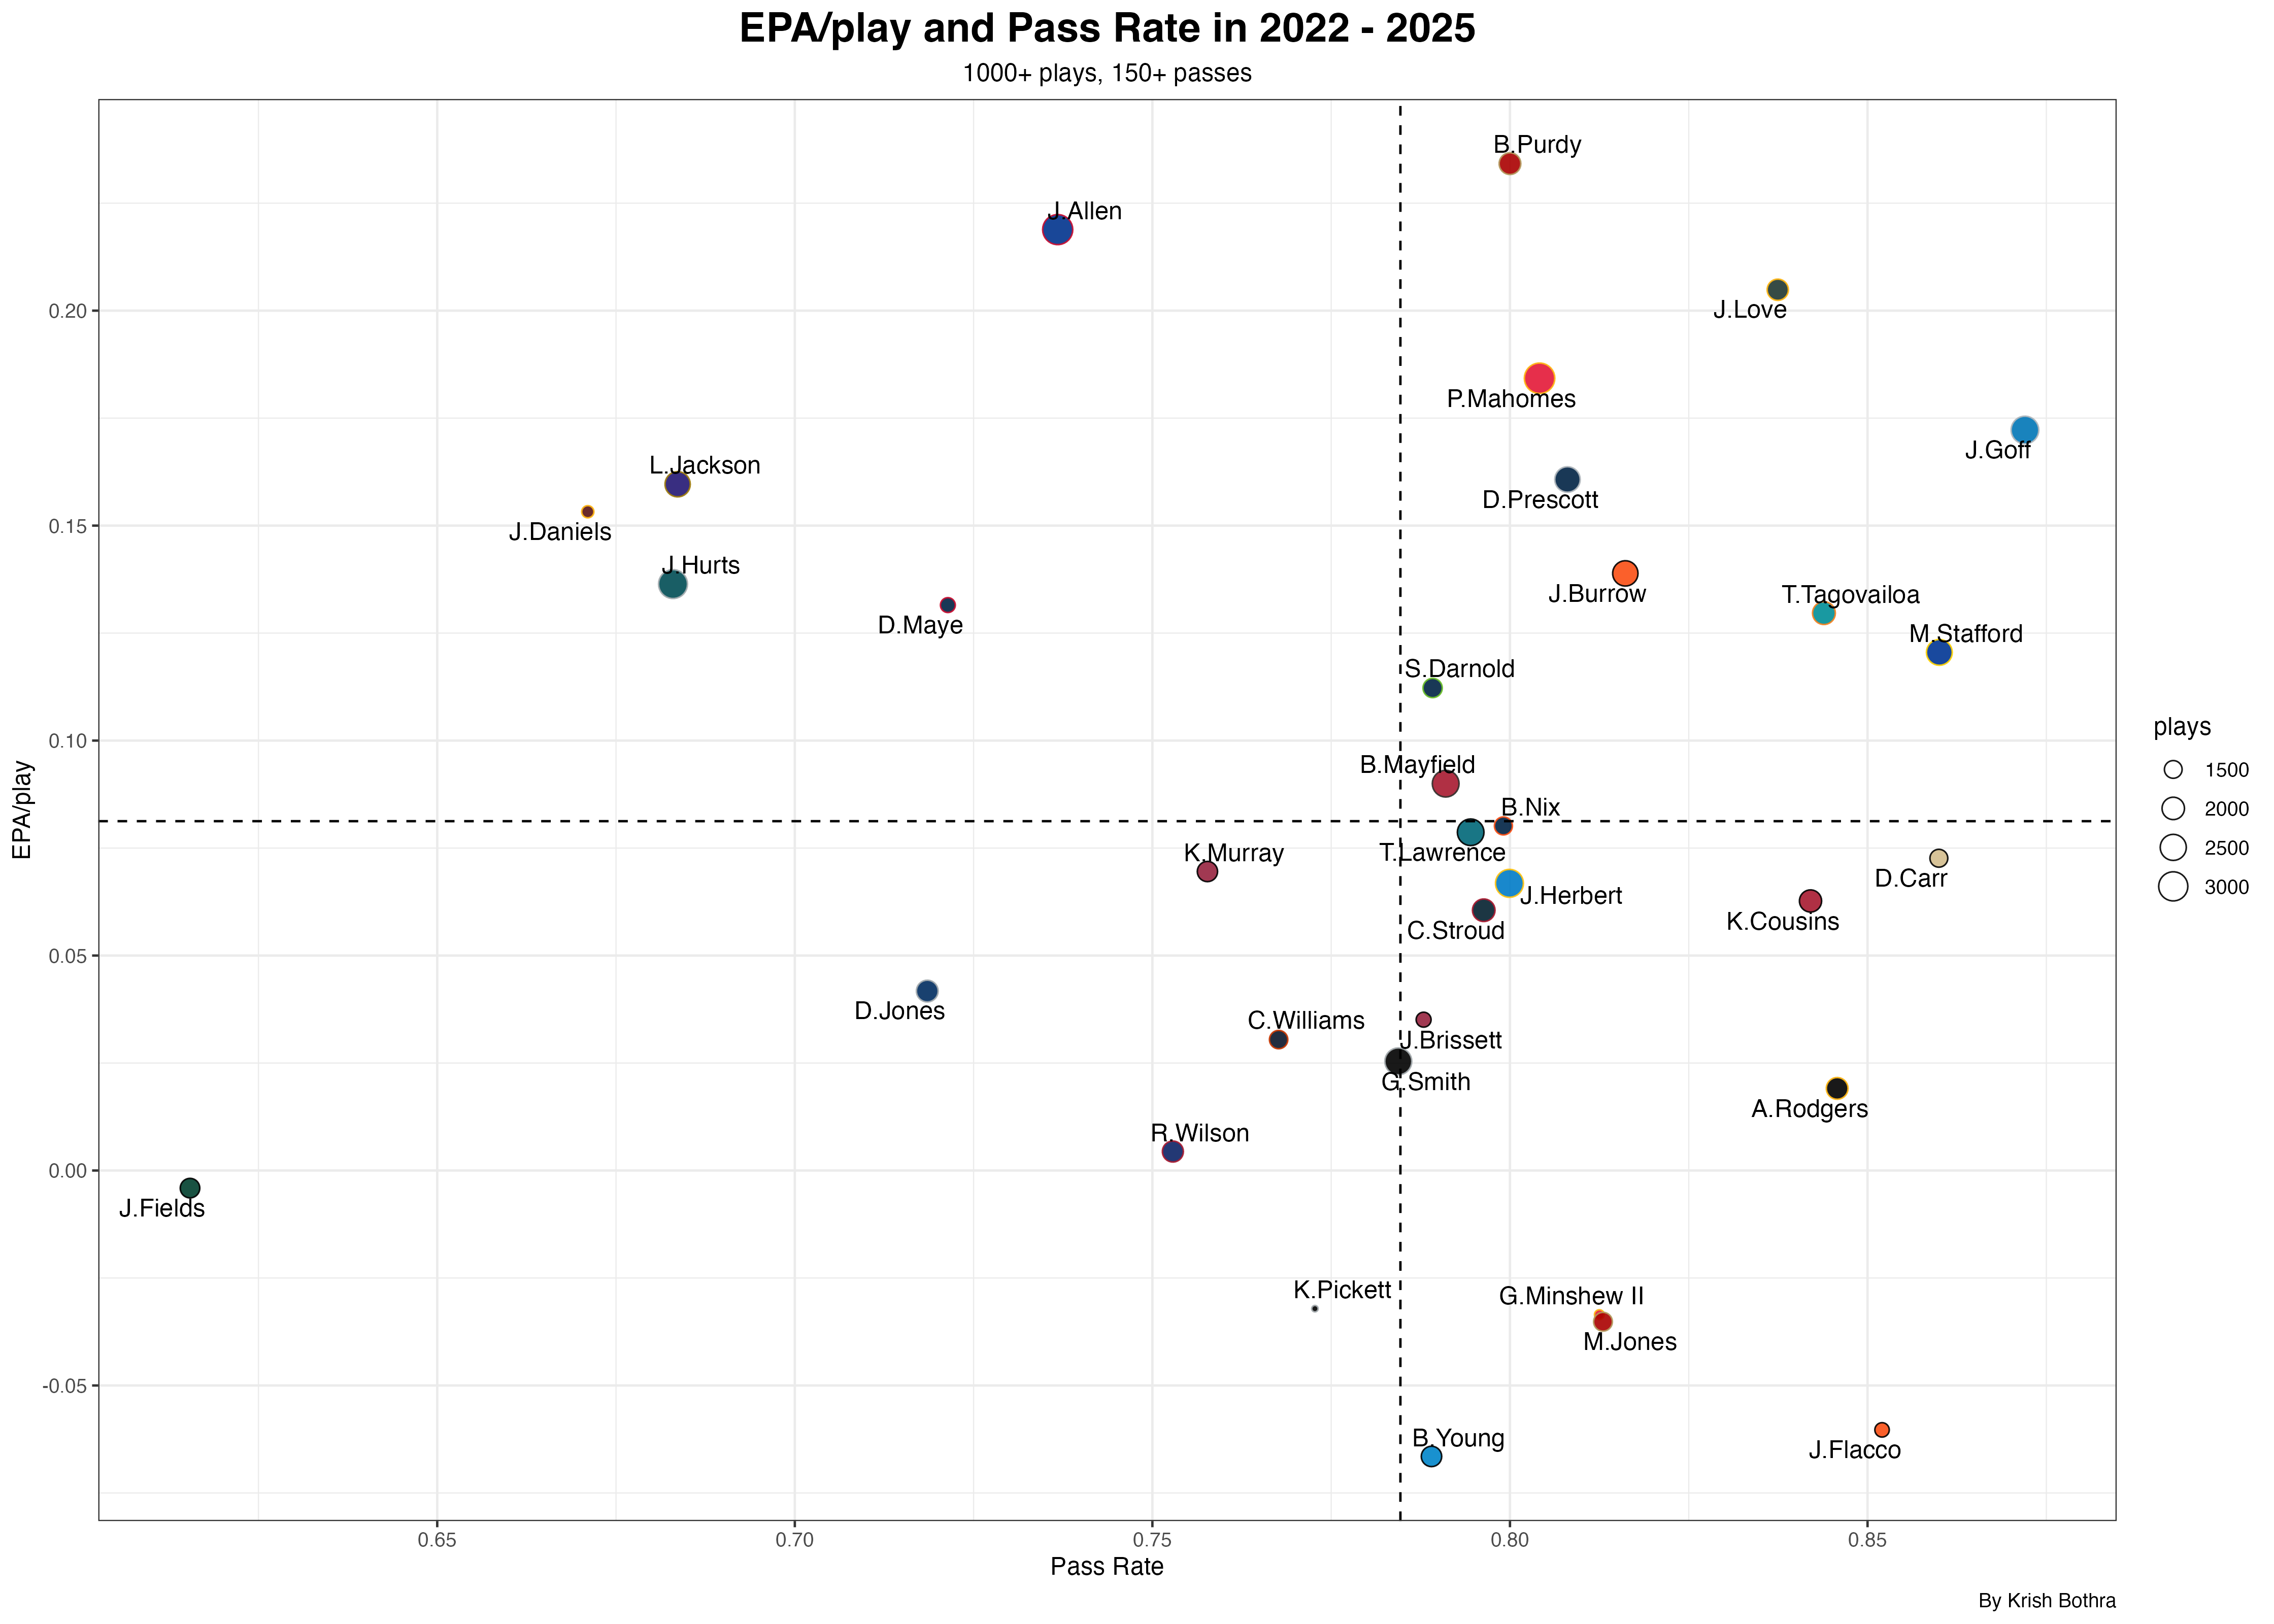
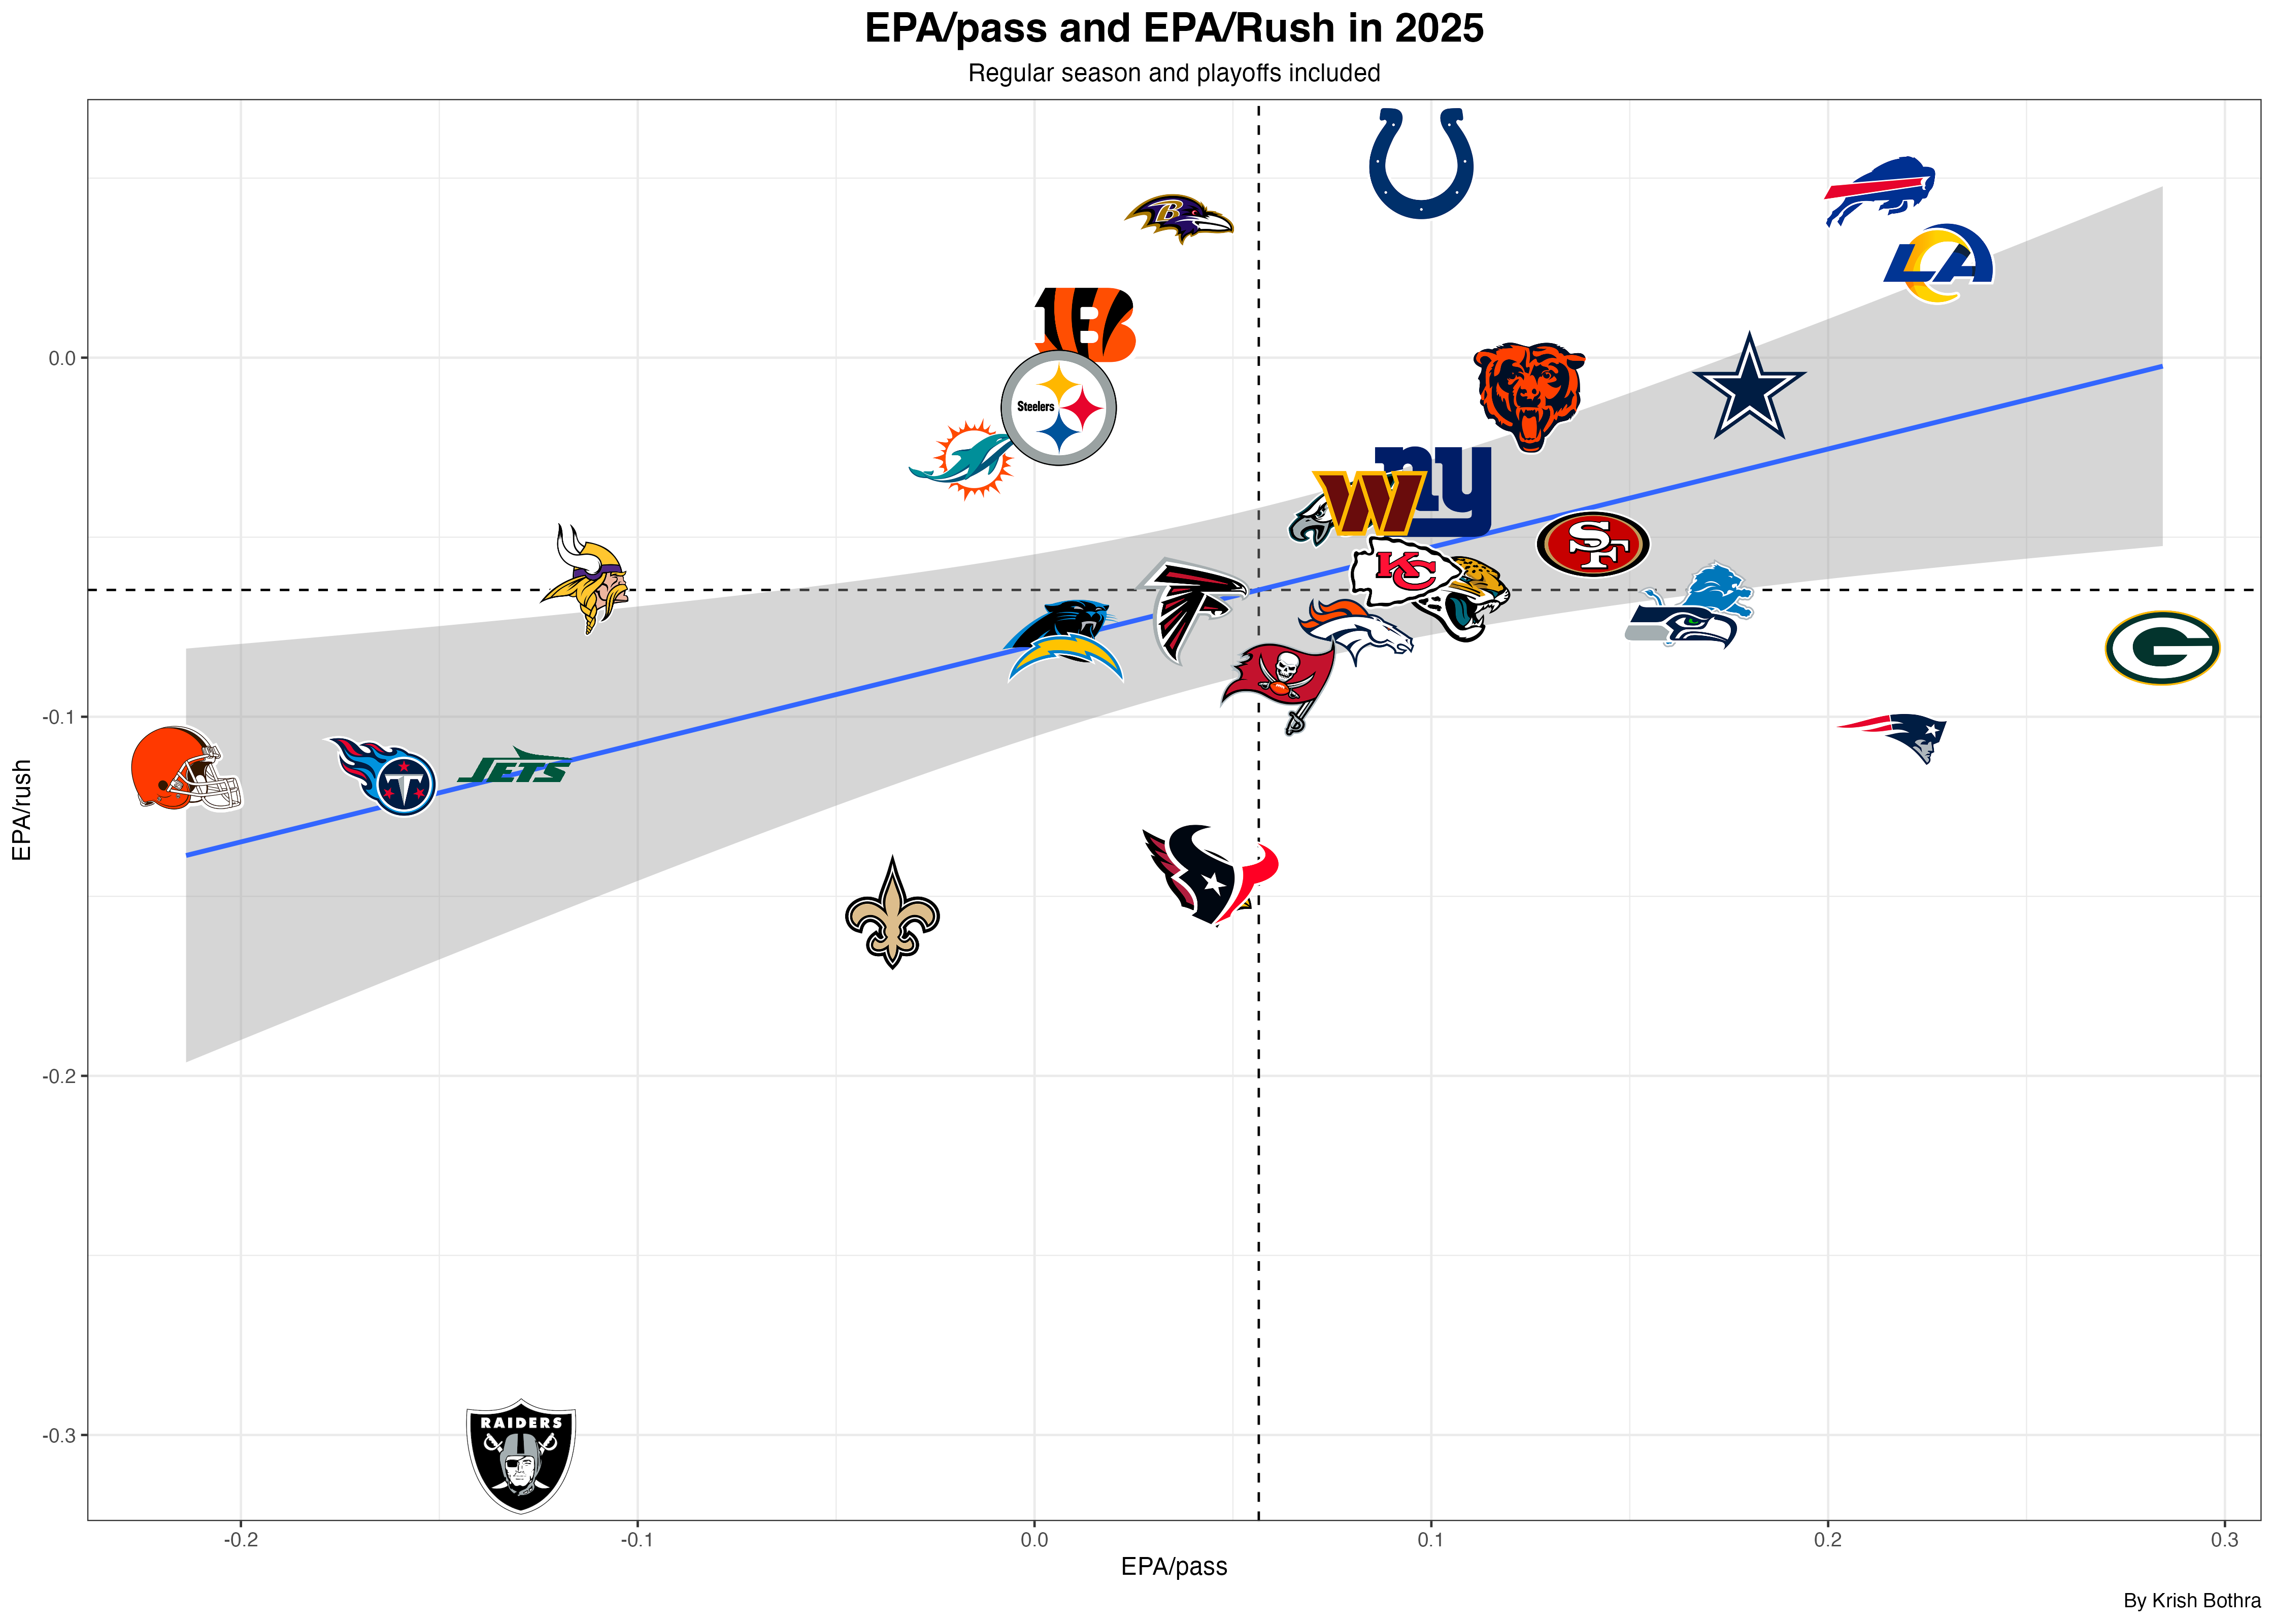
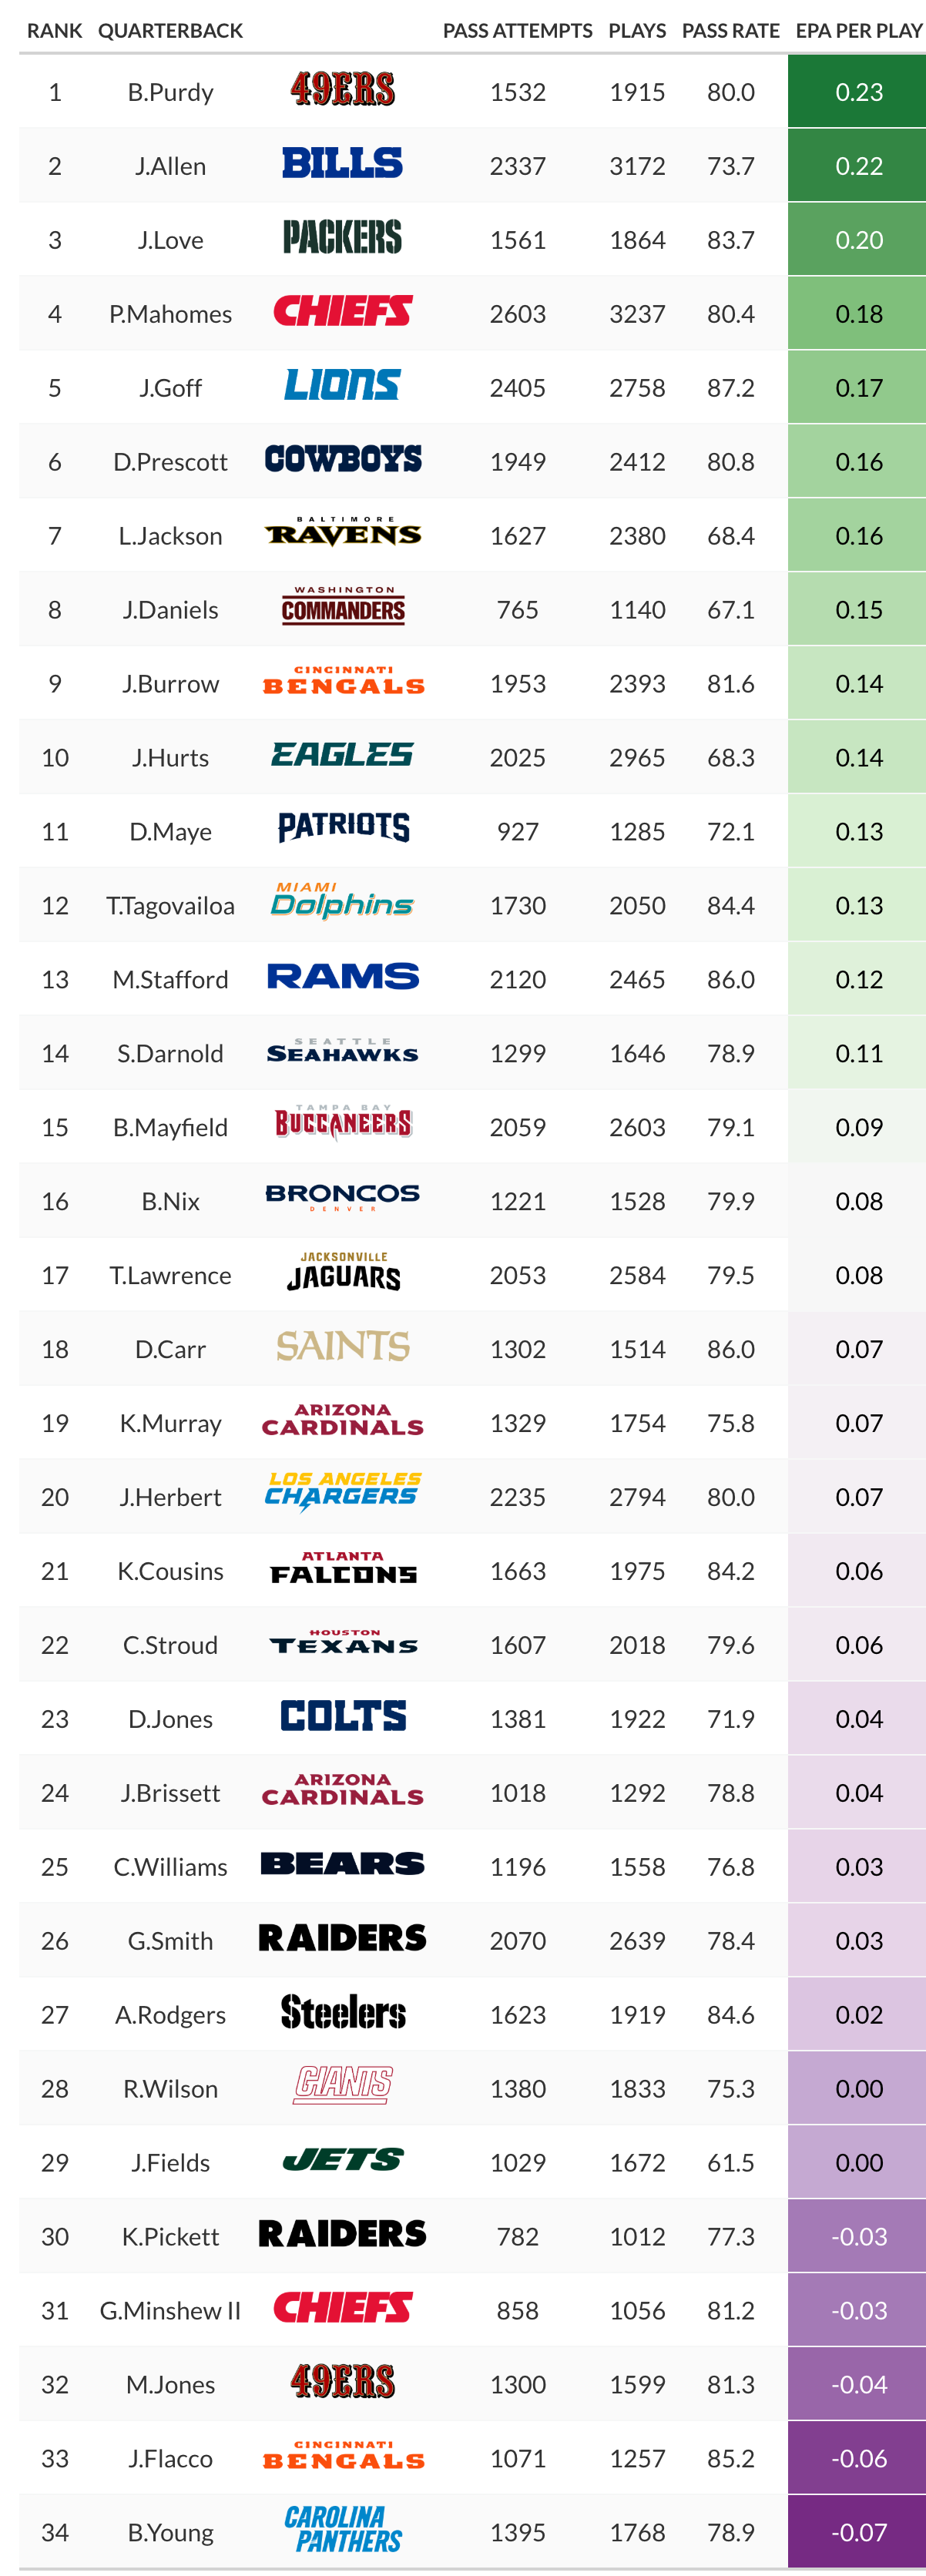
Built logistic and linear regression models in R to predict 4th-down go decisions and quantify Air/Rush Yards Over Expected (AYOE/RYOE) across 4 NFL seasons, controlling for game situation and opponent quality. Trained an XGBoost model ranking 80+ NFL backs by rush yards over expectation and produced publication-quality visuals covering EPA/play, pass rate, and field goal metrics league-wide.
Visuals


Tech Stack
R, ggplot2, nflreadr, xgboost, tidymodels, dplyr